Market Outlook
November 28, 2016
Market Cues
Domestic Indices
Chg (%)
(Pts)
(Close)
Indian market is expected to open on a negative note tracking the SGX Nifty.
BSE Sensex
1.8
456
26,316
The US markets closed slightly higher during Friday’s shortened trading session as
Nifty
1.9
149
8,114
stocks extended gains on optimism over the Trump presidency. The US Commerce
Mid Cap
1.3
157
12,183
Dept. released a report showing that the trade deficit in goods widened much more
Small Cap
2.0
235
12,028
than expectations. The goods deficit widened to $62bln in October against an
Bankex
1.2
247
21,185
expectation of $59.7bln.
The FTSE moved higher as UK GDP data came in line with expectations. Pharma
Global Indices
Chg (%)
(Pts)
(Close)
stock AstraZeneca moved up 2.17 percent after an analyst upgrade. While stocks
Dow Jones
0.4
69
19,152
Daily Mail and General Trust dropped about
3.95 percent after they were
downgraded by Barclays from to Underweight from Equal weight.
Nasdaq
0.3
18
5,399
FTSE
0.2
12
6,841
Indian stocks gave a strong broad based rally on Friday as value buying pushed
stocks higher. Indian markets were able to shrug off concerns of the impact of
Nikkei
0.3
48
18,381
demonetization and a weak rupee to post its highest one day gain in six months.
Hang Seng
0.5
115
22,723
The IT index gave the strongest performance and closed up 4.75 percent due to
Shanghai Com
0.6
20
3,262
weakness in the rupee. The Pharma index was also up by 3 percent as investors
ignored negative developments from Sun Pharma.
Advances / Declines
BSE
NSE
News Analysis
Advances
2,063
1,382
SpiceJet reports Q2FY17 profit of `59cr
Declines
578
262
Cipla to sell animal health division
Unchanged
168
46
Detailed analysis on Pg2
Volumes (` Cr)
Investor’s Ready Reckoner
BSE
2,608
Key Domestic & Global Indicators
NSE
18,845
Stock Watch: Latest investment recommendations on 150+ stocks
Refer Pg5 onwards
Net Inflows (` Cr)
Net
Mtd
Ytd
Top Picks
FII
(2,038)
(14,896)
30,119
CMP
Target
Upside
Company
Sector
Rating
(`)
(`)
(%)
MFs
960
9,900
31,953
Amara Raja BatteriesAuto & Auto Ancill.
Buy
930
1,167
25.5
HCL Tech
IT
Buy
801
1,000
24.9
Top Gainers
Price (`)
Chg (%)
Asian Granito
Capital Goods
Buy
196
351
78.9
Amtekauto
39
10.9
Equitas Holdings
Financials
Buy
159
235
48.0
Piind
886
9.1
Navkar Corporation Others
Buy
179
265
48.1
More Top Picks on Pg3
Nationalum
57
7.7
Unitech
5
7.7
Key Upcoming Events
Tataelxsi
1,243
7.4
Previous
Consensus
Date
Region
Event Description
Reading
Expectations
Nov 29 US
GDP QoQ (Annualised)
2.9
3.0
Top Losers
Price (`)
Chg (%)
Nov 29 Euro Zone Euro Zone Consumer Confidence
(6.1)
--
Bajajhldng
2,040
(2.9)
Nov 29 US
Consumer Confidence
98.6
101.2
Nov 30 Germany PMI Manufacturing
54.4
--
Apollohosp
1,196
(2.7)
Dec 1 Euro Zone Euro-Zone Consumer Confidence
(6.10)
(6.10)
Pcjeweller
360
(2.5)
More Events on Pg4
Concor
1,160
(2.3)
Get&D
316
(2.0)
As on November 25, 2016
Market Outlook
November 28, 2016
News Analysis
SpiceJet reports Q2FY17 profit of `59cr
SpiceJet reported its seventh straight quarter of profits with a profit of `59cr for
Q2FY17. This is an increase of 103 percent YoY and was driven by an increase in
operating margins to 24 per cent due to costs declining by 10 per cent.
This performance came in spite of Q2 generally being the weakest quarter of the
year and in the face of intense competition.
The airline's revenue rose 35 per cent YoY to `1,400cr as its capacity grew 38 per
cent during the period. The average unit fare improved by 5 per cent despite
competitive pressure.
The airline recorded a passenger load factor of 92.3 per cent in Q2FY17, the
highest in the industry. In fact, it has been increasing at the fastest pace for the
past 19 months in a row and the load factor has greater than 90 per cent monthly
since April 2015.
Cipla to sell animal health division
Cipla Ltd is having discussions to sell Cipla Vet, its animal health division, as part
of the company’s restructuring efforts. The company is restructuring its businesses
and offloading non-core ones.
Several Indian firms including Mumbai-based Sequent Scientific Ltd, an associate
company of Strides Shasun Ltd, have submitted bids for Cipla Vet.
Cipla Vet is a leading veterinary pharmaceutical exporter with a presence in over
100 countries.
Economic and Political News
National civil aviation policy expected to increase the number of functional
airports in the country to 150-200 over the next few years
Finance ministry asks banks to open accounts for the unbanked by 30
November
FDI in telecom sector crosses $10 billion in the first seven months of the
financial year
Corporate News
Airtel payment bank opens over 10,000 savings accounts in 2 days
Tata Motors JLR to manufacture electric cars in Britain
Strides Shasun acquires PediaCare brand for over $5mln
BEML Q2FY17 net loss reduces to `17cr
Market Outlook
November 28, 2016
Top Picks ★★★★★
Large Cap
Market Cap
CMP
Target
Upside
Company
Rationale
(` Cr)
(`)
(`)
(%)
To outpace battery industry growth due to better
Amara Raja Batteries
15,880
930
1,167
25.5
technological products leading to market share gains in both
the automotive OEM and replacement segments.
The stock is trading at attractive valuations and is factoring
HCL Tech
1,12,995
801
1,000
24.9
all the bad news.
Back on the growth trend; expect a long term growth of 14%
Infosys
2,24,480
977
1,249
27.8
to be a US$20bn in FY2020.
Source: Company, Angel Research
Mid Cap
Market Cap
CMP
Target
Upside
Company
Rationale
(` Cr)
(`)
(`)
(%)
We expect the company would report strong profitability
Asian Granito
590
196
351
78.9
owing to better product mix, higher B2C sales and
amalgamation synergy.
Among the top 4 players in the consumer durables segment.
Bajaj Electricals
2,189
217
274
26.3
Improved profitability backed by turn around in E&P segment.
Strong order book lends earnings visibility.
Favourable outlook for the AC industry to augur well for
Cooling products business which is out pacing the market
Blue Star
4,405
462
634
37.2
growth. EMPPAC division's profitability to improve once
operating environment turns around.
With a focus on the low and medium income (LMI) consumer
Dewan Housing Finance
7,450
238
350
47.1
segment, the company has increased its presence in tier-II &
III cities where the growth opportunity is immense.
Strong loan growth backed by diversified loan portfolio and
Equitas Holdings
5,326
159
235
48.0
adequate CAR. ROE & ROA likely to remain decent as risk of
dilution remains low. Attractive valuations considering growth.
Economic recovery to have favourable impact on advertising
& circulation revenue growth. Further, the acquisition of a
Jagran Prakashan
5,548
170
225
32.6
radio business (Radio City) would also boost the company's
revenue growth.
Speedier execution and speedier sales, strong revenue visibilty
Mahindra Lifespace
1,498
365
522
43.0
in short-to-long run, attractive valuations
We expect the company to report strong growth on back of
healthy growth in domestic branded sales (owing to
Mirza International
946
79
107
36.1
aggressive ad spend and addition in the number of EBOs &
multi-brand outlets [MBOs]) and healthy export revenues.
Massive capacity expansion along with rail advantage at ICD
Navkar Corporation
2,552
179
265
48.1
as well CFS augurs well for the company.
Strong brands and distribution network would boost growth
Siyaram Silk Mills
1,147
1,224
1,605
31.2
going ahead. Stock currently trades at an inexpensive
valuation.
Market leadership in Hindi news genre and no. 2 viewership
ranking in English news genre, exit from the radio business,
TV Today Network
1,862
312
385
23.3
and anticipated growth in ad spends by corporate to benefit
the stock.
Source: Company, Angel Research
Market Outlook
November 28, 2016
Key Upcoming Events
Global economic events release calendar
Bloomberg Data
Date
Time
Country
Event Description
Unit
Period
Last Reported
Estimated
Nov 29, 2016
3:30 PM Euro ZoneEuro-Zone Consumer Confidence
Value Nov F
(6.10)
(6.10)
8:30 PM
US
Consumer ConfidenceS.A./ 1985=100
Nov
98.60
101.20
7:00 PM
US
GDP Qoq (Annualised)
% Change 3Q S
2.90
3.00
Nov 30, 2016
2:25 PM
Germany
Unemployment change (000's)
Thousands
Nov
(13.00)
(5.00)
Dec 01, 2016
3:00 PM
UK
PMI Manufacturing
Value
Nov
54.30
54.20
7:00 PM
US
Initial Jobless claims
Thousands
Nov 26
251.00
2:25 PM
Germany
PMI Manufacturing
Value Nov F
54.40
54.40
6:30 AM
China
PMI Manufacturing
Value
Nov
51.20
51.00
Dec 02, 2016
7:00 PM
US
Change in Nonfarm payrolls
Thousands
Nov
161.00
180.00
7:00 PM
US
Unnemployment rate
% Nov
4.90
4.90
Dec 05, 2016
2:25 PM
Germany
PMI Services
Value Nov F
55.00
Dec 06, 2016
3:30 PM Euro Zone
Euro-Zone GDP s.a. (QoQ)
% Change 3Q F
0.30
Dec 07, 2016
3:00 PM
UK
Industrial Production (YoY)
% Change
Oct
0.30
2:30 PM
India
RBI Reverse Repo rate
% Dec 7
5.75
2:30 PM
India
RBI Repo rate
% Dec 7
6.25
2:30 PM
India
RBI Cash Reserve ratio
% Dec 7
4.00
Dec 08, 2016
6:15 PM Euro Zone
ECB announces interest rates
% Dec 8
-
China
Exports YoY%
% Change Nov
(7.30)
Dec 09, 2016
India
Imports YoY%
% Change Nov
8.10
India
Exports YoY%
% Change Nov
9.59
7:00 AM
China
Consumer Price Index (YoY)
% Change Nov
2.10
Dec 12, 2016
5:30 PM
India
Industrial Production YoY
% Change
Oct
0.70
Dec 13, 2016
3:00 PM
UK
CPI (YoY)
% Change Nov
0.90
7:30 AM
China
Industrial Production (YoY)
% Change Nov
6.10
Source: Bloomberg, Angel Research
Market Outlook
November 28, 2016
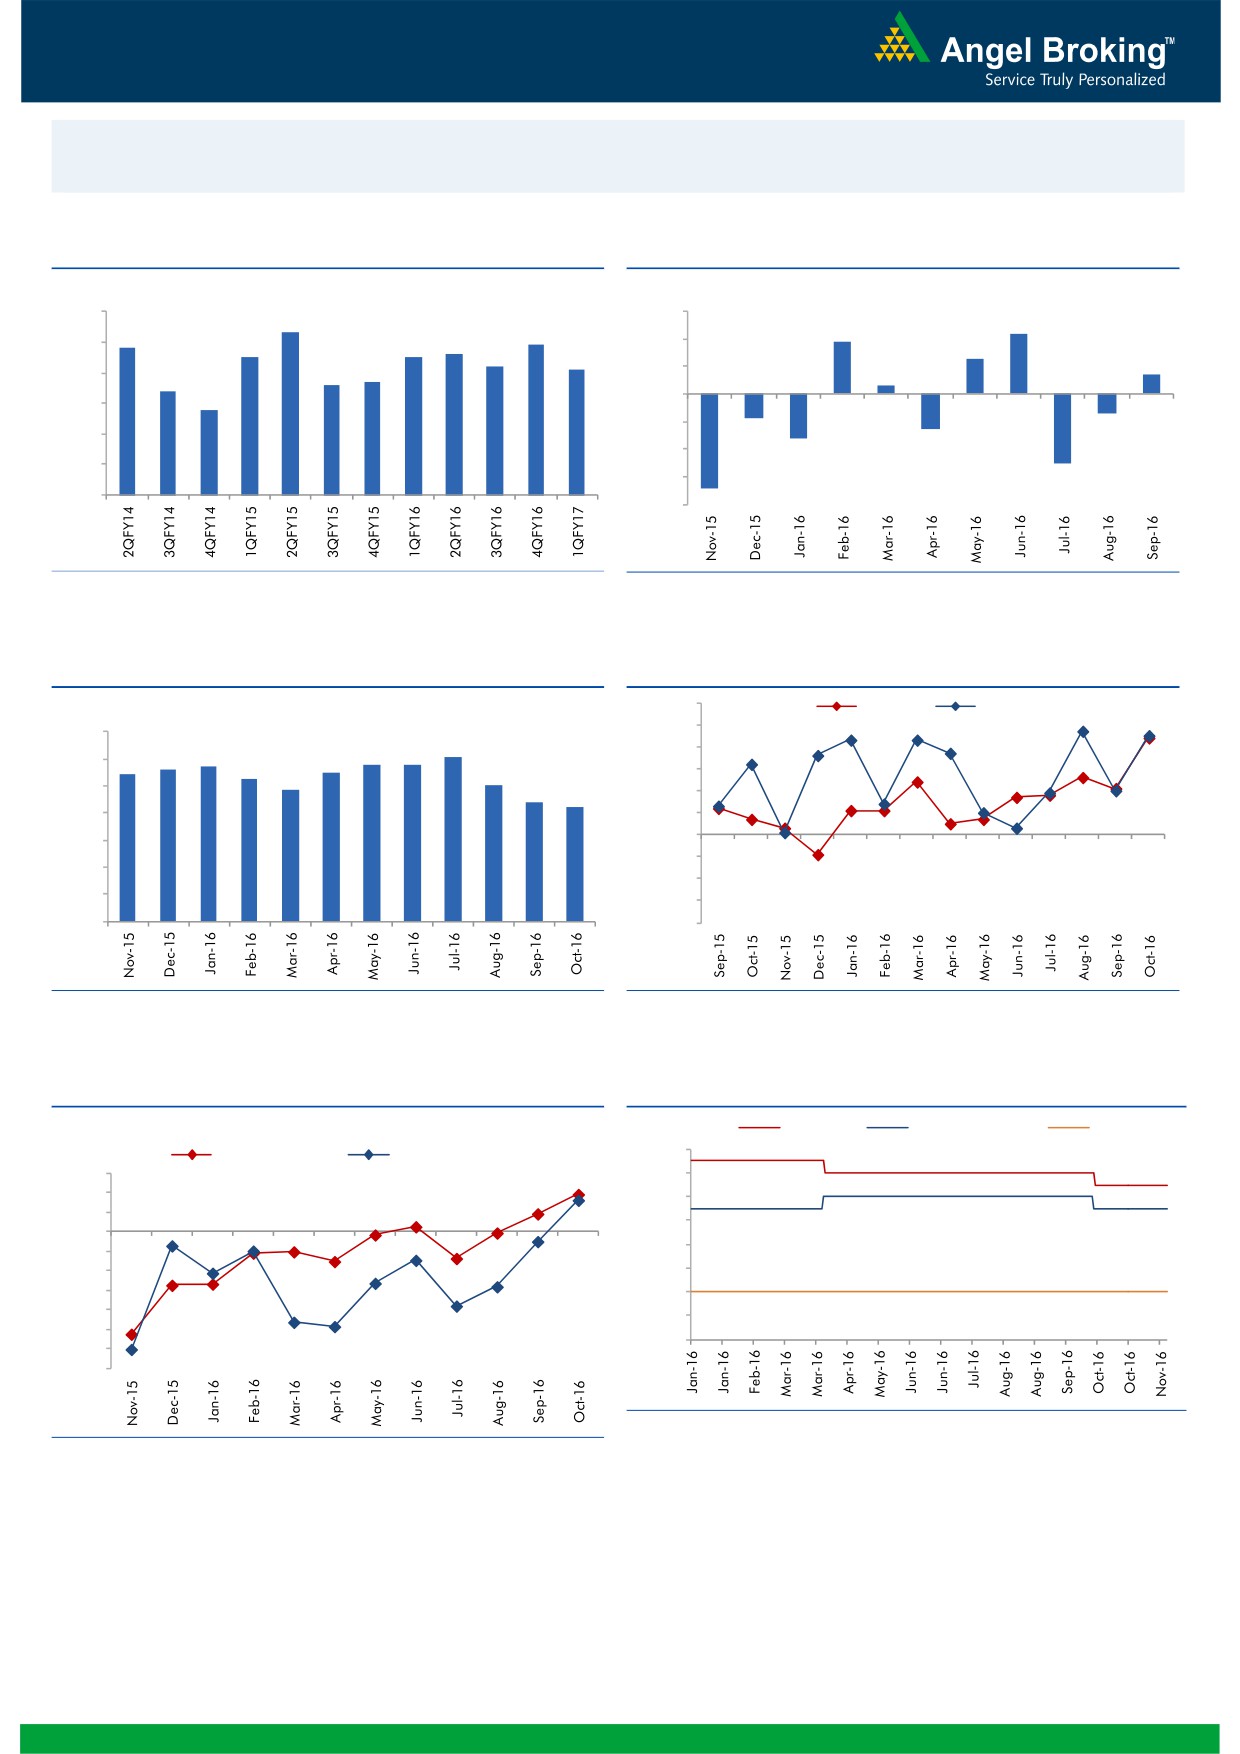
Macro watch
Exhibit 1: Quarterly GDP trends
Exhibit 2: IIP trends
(%)
(%)
9.0
3.0
8.3
2.2
7.9
1.9
7.8
8.0
7.5
7.5
7.6
2.0
1.3
7.2
7.1
0.7
6.6
6.7
1.0
0.3
7.0
6.4
5.8
-
6.0
(1.0)
5.0
(0.7)
(0.9)
(2.0)
(1.3)
(1.6)
4.0
(3.0)
(2.5)
3.0
(4.0)
(3.4)
Source: CSO, Angel Research
Source: MOSPI, Angel Research
Exhibit 3: Monthly CPI inflation trends
Exhibit 4: Manufacturing and services PMI
56.0
Mfg. PMI
Services PMI
(%)
55.0
7.0
6.1
5.7
5.8
5.8
54.0
6.0
5.4
5.6
5.5
5.3
5.1
53.0
4.8
5.0
4.4
4.2
52.0
4.0
51.0
3.0
50.0
49.0
2.0
48.0
1.0
47.0
-
46.0
Source: MOSPI, Angel Research
Source: Market, Angel Research; Note: Level above 50 indicates expansion
Exhibit 5: Exports and imports growth trends
Exhibit 6: Key policy rates
c
(%)
Repo rate
Reverse Repo rate
CRR
7.00
(%)
Exports yoy growth
Imports yoy growth
15.0
6.50
10.0
6.00
5.0
5.50
0.0
5.00
(5.0)
(10.0)
4.50
(15.0)
4.00
(20.0)
3.50
(25.0)
3.00
(30.0)
(35.0)
Source: RBI, Angel Research
Source: Bloomberg, Angel Research
Market Outlook
November 28, 2016
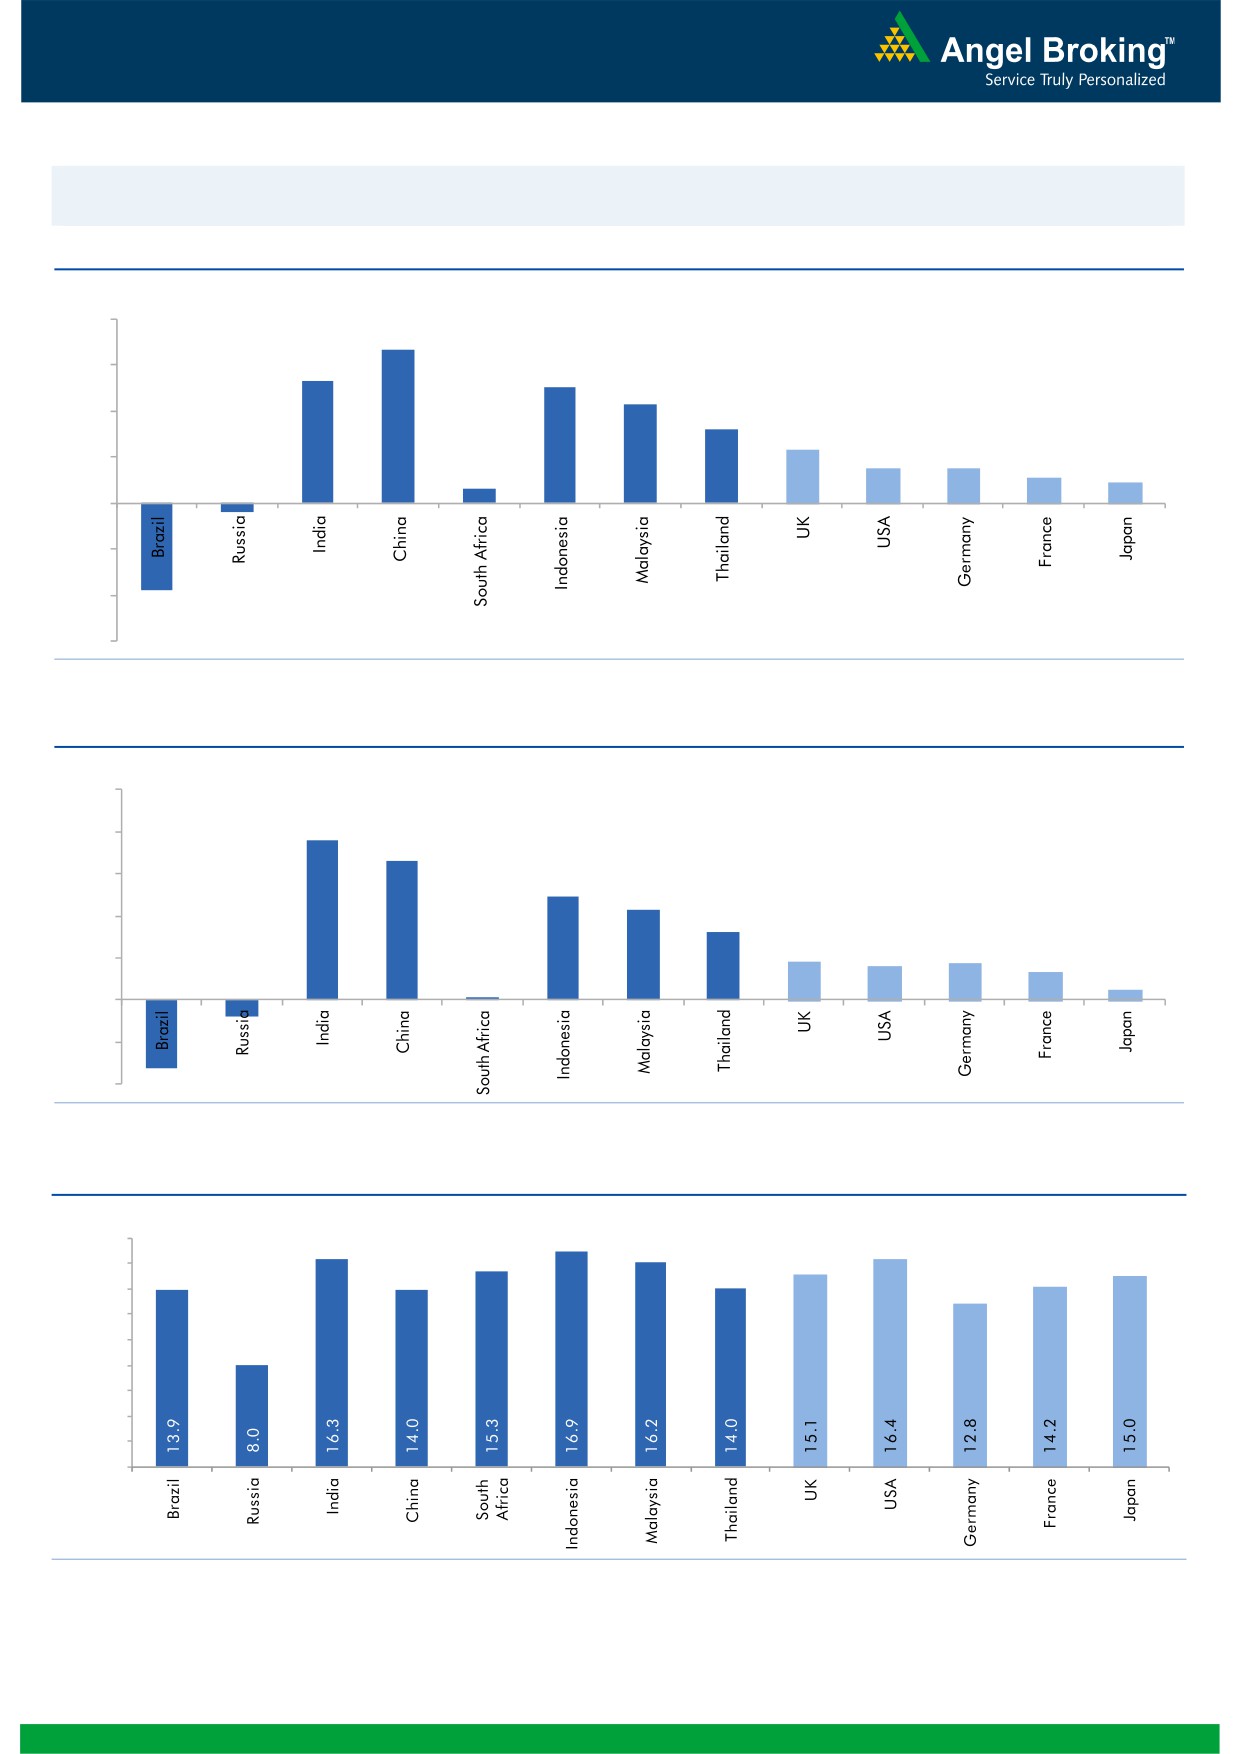
Global watch
Exhibit 1: Latest quarterly GDP Growth (%, yoy) across select developing and developed countries
(%)
8.0
6.7
6.0
5.3
0.6
5.0
4.3
4.0
3.2
2.3
1.5
1.5
2.0
1.1
0.9
-
(2.0)
(0.4)
(4.0)
(3.8)
(6.0)
Source: Bloomberg, Angel Research
Exhibit 2: 2016 GDP Growth projection by IMF (%, yoy) across select developing and developed countries
(%)
10.0
7.6
8.0
6.6
6.0
4.9
4.3
4.0
3.2
1.8
1.7
1.6
1.3
2.0
(0.8)
0.5
(3.3)
0.1
-
(2.0)
(4.0)
Source: IMF, Angel Research
Exhibit 3: One year forward P-E ratio across select developing and developed countries
(x)
18.0
16.0
14.0
12.0
10.0
8.0
6.0
4.0
2.0
-
Source: IMF, Angel Research
Market Outlook
November 28, 2016
Exhibit 4: Relative performance of indices across globe
Returns (%)
Country
Name of index
Closing price
1M
3M
1YR
Brazil
Bovespa
61,559
(3.9)
6.1
27.9
Russia
Micex
2,098
6.1
5.3
14.4
India
Nifty
8,114
(6.6)
(6.0)
4.9
China
Shanghai Composite
3,262
5.3
5.4
(8.2)
South Africa
Top 40
44,209
(1.8)
(5.8)
(5.3)
Mexico
Mexbol
45,358
(6.3)
(5.0)
2.5
Indonesia
LQ45
854
(8.3)
(7.9)
10.0
Malaysia
KLCI
1,627
(2.8)
(3.3)
(2.0)
Thailand
SET 50
935
(0.3)
(5.2)
4.8
USA
Dow Jones
19,152
5.4
3.8
7.6
UK
FTSE
6,841
(1.7)
0.0
7.6
Japan
Nikkei
18,381
6.7
10.7
(5.2)
Germany
DAX
10,699
(0.1)
1.1
(6.0)
France
CAC
4,550
0.3
2.8
(3.5)
Source: Bloomberg, Angel Research
Stock Watch
November 28, 2016
Company Name
Reco
CMP
Target
Mkt Cap
Sales ( Čcr )
OPM(%)
EPS (Č)
PER(x)
P/BV(x)
RoE(%)
EV/Sales(x)
(Č)
Price ( Č)
( Č cr )
FY17E FY18E
FY17E
FY18E
FY17E
FY18E
FY17E
FY18E
FY17E
FY18E
FY17E
FY18E
FY17E
FY18E
Agri / Agri Chemical
Rallis
Neutral
201
-
3,910
1,937
2,164
13.3
14.3
9.0
11.0
22.3
18.3
3.9
3.4
18.4
19.8
2.1
1.8
United Phosphorus
Accumulate
628
684
31,832
15,176
17,604
18.5
18.5
37.4
44.6
16.8
14.1
3.3
2.7
21.4
21.2
2.2
1.9
Auto & Auto Ancillary
Ashok Leyland
Buy
77
111
21,927
22,407
26,022
10.6
10.6
5.2
6.4
14.8
12.0
3.3
2.8
23.6
24.7
1.1
0.9
Bajaj Auto
Neutral
2,613
-
75,607
25,093
27,891
19.5
19.2
143.9
162.5
18.2
16.1
5.1
4.4
30.3
29.4
2.7
2.4
Bharat Forge
Neutral
908
-
21,135
7,726
8,713
20.5
21.2
35.3
42.7
25.7
21.3
4.8
4.3
18.9
20.1
2.8
2.4
Eicher Motors
Neutral
20,223
-
54,927
16,583
20,447
17.5
18.0
598.0
745.2
33.8
27.1
11.6
8.8
41.2
38.3
3.1
2.5
Gabriel India
Buy
112
130
1,605
1,544
1,715
9.0
9.3
5.4
6.3
20.7
17.7
3.9
3.5
18.9
19.5
1.0
0.9
Hero Motocorp
Buy
3,039
3,541
60,687
30,958
34,139
15.7
15.7
193.6
208.3
15.7
14.6
6.1
5.1
34.2
30.5
1.8
1.6
Jamna Auto Industries Neutral
181
-
1,443
1,486
1,620
9.8
9.9
15.0
17.2
12.1
10.5
2.6
2.2
21.8
21.3
1.0
0.9
L G Balakrishnan & Bros Neutral
606
-
951
1,302
1,432
11.6
11.9
43.7
53.0
13.9
11.4
2.0
1.8
13.8
14.2
0.8
0.7
Mahindra and Mahindra Neutral
1,175
-
72,985
46,534
53,077
11.6
11.7
67.3
78.1
17.5
15.1
2.8
2.5
15.4
15.8
1.5
1.3
Maruti
Buy
4,874
6,006
147,222
68,057
82,958
15.8
15.5
212.1
261.2
23.0
18.7
4.6
3.8
19.8
20.3
1.8
1.4
Minda Industries
Neutral
306
-
2,429
2,728
3,042
9.0
9.1
68.2
86.2
4.5
3.6
1.0
0.8
23.8
24.3
1.0
0.8
Motherson Sumi
Neutral
302
-
42,410
45,896
53,687
7.8
8.3
13.0
16.1
23.2
18.8
7.5
6.0
34.7
35.4
1.0
0.8
Rane Brake Lining
Neutral
995
-
788
511
562
11.3
11.5
28.1
30.9
35.4
32.2
5.4
4.9
15.3
15.0
1.7
1.5
Setco Automotive
Neutral
38
-
509
741
837
13.0
13.0
15.2
17.0
2.5
2.2
0.4
0.4
15.8
16.3
1.1
1.0
Tata Motors
Neutral
453
-
130,863
300,209
338,549
8.9
8.4
42.7
54.3
10.6
8.4
1.7
1.4
15.6
17.2
0.6
0.5
TVS Motor
Neutral
356
-
16,913
13,390
15,948
6.9
7.1
12.8
16.5
27.9
21.5
6.9
5.5
26.3
27.2
1.3
1.1
Amara Raja Batteries
Buy
930
1,167
15,880
5,504
6,605
18.4
19.8
33.4
40.9
27.8
22.7
6.1
5.0
22.1
22.0
2.9
2.4
Exide Industries
Neutral
176
-
14,918
7,439
8,307
15.0
15.0
8.1
9.3
21.7
18.9
3.0
2.7
14.3
16.7
1.6
1.4
Apollo Tyres
Buy
181
235
9,206
12,877
14,504
14.3
13.9
21.4
23.0
8.4
7.9
1.3
1.1
16.4
15.2
0.9
0.8
Ceat
Buy
1,161
1,450
4,696
7,524
8,624
13.0
12.7
131.1
144.3
8.9
8.1
1.6
1.4
19.8
18.6
0.7
0.6
JK Tyres
Neutral
119
-
2,706
7,455
8,056
15.0
15.0
21.8
24.5
5.5
4.9
1.1
0.9
22.8
21.3
0.5
0.4
Swaraj Engines
Neutral
1,325
-
1,646
660
810
15.2
16.4
54.5
72.8
24.3
18.2
7.6
6.9
31.5
39.2
2.3
1.9
Subros
Neutral
161
-
965
1,488
1,681
11.7
11.9
6.4
7.2
25.1
22.4
2.7
2.4
10.8
11.4
0.9
0.8
Indag Rubber
Neutral
175
-
459
286
326
19.8
16.8
11.7
13.3
15.0
13.1
2.5
2.4
17.8
17.1
1.3
1.1
Capital Goods
ACE
Neutral
48
-
478
709
814
4.1
4.6
1.4
2.1
34.5
23.0
1.4
1.3
4.4
6.0
0.8
0.7
BEML
Neutral
804
-
3,348
3,451
4,055
6.3
9.2
31.4
57.9
25.6
13.9
1.5
1.4
6.3
10.9
1.1
0.9
Bharat Electronics
Accumulate
1,305
1,414
29,143
8,137
9,169
16.8
17.2
58.7
62.5
22.2
20.9
3.4
3.1
44.6
46.3
2.6
2.3
Stock Watch
November 28, 2016
Company Name
Reco
CMP
Target
Mkt Cap
Sales ( Čcr )
OPM(%)
EPS (Č)
PER(x)
P/BV(x)
RoE(%)
EV/Sales(x)
(Č)
Price ( Č)
( Č cr )
FY17E
FY18E
FY17E
FY18E
FY17E
FY18E
FY17E
FY18E
FY17E
FY18E
FY17E
FY18E
FY17E
FY18E
Capital Goods
Voltas
Buy
300
407
9,936
6,511
7,514
7.9
8.7
12.9
16.3
23.3
18.4
4.2
3.7
16.7
18.5
1.3
1.1
BGR Energy
Neutral
108
-
776
16,567
33,848
6.0
5.6
7.8
5.9
13.8
18.2
0.8
0.8
4.7
4.2
0.1
0.1
BHEL
Neutral
127
-
31,048
28,797
34,742
-
2.8
2.3
6.9
55.2
18.4
0.9
0.9
1.3
4.8
0.7
0.5
Blue Star
Buy
462
634
4,405
4,283
5,077
5.9
7.3
14.9
22.1
31.0
20.9
6.0
5.1
20.4
26.4
1.1
0.9
Crompton Greaves
Neutral
74
-
4,629
5,777
6,120
5.9
7.0
3.3
4.5
22.4
16.4
1.0
0.9
4.4
5.9
0.8
0.6
Greaves Cotton
Neutral
125
-
3,044
1,755
1,881
16.8
16.9
7.8
8.5
16.0
14.7
3.2
3.0
20.6
20.9
1.4
1.3
Inox Wind
Neutral
178
-
3,940
5,605
6,267
15.7
16.4
24.8
30.0
7.2
5.9
2.0
1.5
25.9
24.4
0.7
0.6
KEC International
Neutral
140
-
3,597
9,294
10,186
7.9
8.1
9.9
11.9
14.1
11.8
2.1
1.8
15.6
16.3
0.6
0.6
Thermax
Neutral
832
-
9,917
5,421
5,940
7.3
7.3
25.7
30.2
32.4
27.6
3.9
3.6
12.2
13.1
1.7
1.6
VATech Wabag
Buy
497
681
2,710
3,136
3,845
8.9
9.1
26.0
35.9
19.1
13.9
2.4
2.0
13.4
15.9
0.8
0.6
Cement
ACC
Neutral
1,313
-
24,663
11,225
13,172
13.2
16.9
44.5
75.5
29.5
17.4
2.8
2.6
11.2
14.2
2.2
1.9
Ambuja Cements
Neutral
203
-
40,328
9,350
10,979
18.2
22.5
5.8
9.5
35.0
21.4
2.9
2.6
10.2
12.5
4.3
3.7
India Cements
Neutral
118
-
3,614
4,364
4,997
18.5
19.2
7.9
11.3
14.9
10.4
1.1
1.0
8.0
8.5
1.6
1.4
JK Cement
Neutral
680
-
4,756
4,398
5,173
15.5
17.5
31.2
55.5
21.8
12.3
2.6
2.3
12.0
15.5
1.6
1.3
J K Lakshmi Cement
Buy
370
565
4,354
2,913
3,412
14.5
19.5
7.5
22.5
49.3
16.5
3.0
2.6
12.5
18.0
2.1
1.7
Orient Cement
Buy
134
215
2,754
2,114
2,558
18.5
20.5
8.1
11.3
16.6
11.9
2.4
2.1
9.0
14.0
1.9
1.5
UltraTech Cement
Neutral
3,497
-
95,971
25,768
30,385
21.0
23.5
111.0
160.0
31.5
21.9
4.0
3.5
13.5
15.8
3.8
3.2
Construction
ITNL
Neutral
99
-
3,260
8,946
10,017
31.0
31.6
8.1
9.1
12.2
10.9
0.5
0.5
4.2
5.0
3.7
3.4
KNR Constructions
Accumulate
725
802
2,040
1,385
1,673
14.7
14.0
41.2
48.5
17.6
15.0
3.3
2.8
14.9
15.2
1.6
1.3
Larsen & Toubro
Buy
1,370
1,700
127,657
67,665
77,249
10.7
11.5
57.3
71.2
23.9
19.2
2.2
2.1
12.6
14.3
2.1
1.8
Gujarat Pipavav Port
Neutral
146
-
7,065
705
788
52.2
51.7
5.0
5.6
29.2
26.1
2.9
2.6
11.2
11.2
9.7
8.2
Nagarjuna Const.
Neutral
77
-
4,253
8,842
9,775
9.1
8.8
5.3
6.4
14.4
12.0
1.1
1.1
8.2
9.1
0.6
0.6
PNC Infratech
Buy
113
143
2,892
2,350
2,904
13.1
13.2
9.0
8.8
12.5
12.8
0.5
0.4
15.9
13.9
1.3
1.1
Simplex Infra
Neutral
289
-
1,429
6,829
7,954
10.5
10.5
31.4
37.4
9.2
7.7
1.0
0.9
9.9
13.4
0.6
0.5
Power Mech Projects
Neutral
459
-
676
1,801
2,219
12.7
14.6
72.1
113.9
6.4
4.0
1.2
1.0
16.8
11.9
0.4
0.3
Sadbhav Engineering
Accumulate
274
298
4,703
3,598
4,140
10.3
10.6
9.0
11.9
30.5
23.0
3.2
2.8
9.9
11.9
1.6
1.4
NBCC
Neutral
226
-
13,581
7,428
9,549
7.9
8.6
8.2
11.0
27.6
20.6
1.4
1.1
28.2
28.7
1.5
1.1
MEP Infra
Neutral
36
-
582
1,877
1,943
30.6
29.8
3.0
4.2
11.9
8.5
5.8
3.9
0.6
0.6
1.7
1.5
SIPL
Neutral
87
-
3,052
1,036
1,252
65.5
66.2
(8.4)
(5.6)
3.3
3.7
(22.8)
(15.9)
11.2
9.3
Stock Watch
November 28, 2016
Company Name
Reco
CMP
Target
Mkt Cap
Sales ( Čcr )
OPM(%)
EPS (Č)
PER(x)
P/BV(x)
RoE(%)
EV/Sales(x)
(Č)
Price ( Č)
( Č cr )
FY17E
FY18E
FY17E
FY18E
FY17E
FY18E
FY17E
FY18E
FY17E
FY18E
FY17E
FY18E
FY17E
FY18E
Construction
Engineers India
Neutral
280
-
9,422
1,725
1,935
16.0
19.1
11.4
13.9
24.5
20.1
3.4
3.3
13.4
15.3
4.4
3.9
Financials
Axis Bank
Buy
471
630
112,500
46,932
53,575
3.5
3.4
32.4
44.6
14.6
10.6
1.9
1.6
13.6
16.5
-
-
Bank of Baroda
Neutral
168
-
38,675
19,980
23,178
1.8
1.8
11.5
17.3
14.6
9.7
1.7
1.4
8.3
10.1
-
-
Canara Bank
Neutral
311
-
16,868
15,225
16,836
1.8
1.8
14.5
28.0
21.4
11.1
1.5
1.2
5.8
8.5
-
-
Dewan Housing Finance Buy
238
350
7,450
2,225
2,688
2.9
2.9
29.7
34.6
8.0
6.9
1.3
1.1
16.1
16.8
-
-
Equitas Holdings
Buy
159
235
5,326
939
1,281
11.7
11.5
5.8
8.2
27.4
19.4
2.4
2.1
10.9
11.5
-
-
Federal Bank
Neutral
71
-
12,148
9,353
10,623
2.9
2.9
4.4
5.8
16.1
12.2
1.5
1.4
9.5
11.0
-
-
HDFC
Neutral
1,242
-
196,324
11,475
13,450
3.4
3.4
45.3
52.5
27.4
23.7
5.3
4.7
20.2
20.5
-
-
HDFC Bank
Accumulate
1,189
1,350
301,062
46,097
55,433
4.5
4.5
58.4
68.0
20.4
17.5
3.6
3.0
18.8
18.6
-
-
ICICI Bank
Buy
260
315
151,211
42,800
44,686
3.1
3.3
18.0
21.9
14.4
11.9
2.0
1.8
11.1
12.3
-
-
LIC Housing Finance
Buy
536
630
27,037
3,712
4,293
2.6
2.5
39.0
46.0
13.7
11.7
2.6
2.2
19.9
20.1
-
-
Punjab Natl.Bank
Neutral
140
-
29,855
23,532
23,595
2.3
2.4
6.8
12.6
20.6
11.1
3.2
2.3
3.3
6.5
-
-
RBL Bank
Neutral
351
-
12,984
1,783
2,309
2.6
2.6
12.7
16.4
27.7
21.4
3.0
2.7
12.8
13.3
-
-
South Ind.Bank
Neutral
21
-
2,856
6,435
7,578
2.5
2.5
2.7
3.1
7.8
6.8
1.0
0.9
10.1
11.2
-
-
St Bk of India
Neutral
261
-
202,570
88,650
98,335
2.6
2.6
13.5
18.8
19.3
13.9
1.8
1.6
7.0
8.5
-
-
Union Bank
Neutral
153
-
10,525
13,450
14,925
2.3
2.3
25.5
34.5
6.0
4.4
0.9
0.8
7.5
10.2
-
-
Yes Bank
Neutral
1,168
-
49,152
8,978
11,281
3.3
3.4
74.0
90.0
15.8
13.0
3.0
2.5
17.0
17.2
-
-
FMCG
Asian Paints
Neutral
945
-
90,659
17,128
18,978
16.8
16.4
19.1
20.7
49.5
45.7
17.2
16.2
34.8
35.5
5.2
4.7
Britannia
Buy
2,958
3,626
35,490
9,594
11,011
14.6
14.9
80.3
94.0
36.8
31.5
15.2
11.7
41.2
-
3.6
3.1
Colgate
Accumulate
923
995
25,097
4,605
5,149
23.4
23.4
23.8
26.9
38.8
34.3
21.5
16.8
64.8
66.8
5.4
4.8
Dabur India
Accumulate
276
304
48,561
8,315
9,405
19.8
20.7
8.1
9.2
34.1
30.0
9.5
7.9
31.6
31.0
5.5
4.8
GlaxoSmith Con*
Neutral
5,044
-
21,214
4,350
4,823
21.2
21.4
179.2
196.5
28.2
25.7
7.5
6.3
27.1
26.8
4.3
3.8
Godrej Consumer
Neutral
1,437
-
48,931
10,235
11,428
18.4
18.6
41.1
44.2
35.0
32.5
7.8
6.5
24.9
24.8
4.9
4.3
HUL
Neutral
833
-
180,282
35,252
38,495
17.8
17.8
20.7
22.4
40.4
37.2
38.6
33.1
95.6
88.9
5.0
4.5
ITC
Buy
229
284
276,120
40,059
44,439
38.3
39.2
9.0
10.1
25.5
22.6
7.1
6.2
27.8
27.5
6.4
5.8
Marico
Buy
255
300
32,938
6,430
7,349
18.8
19.5
6.4
7.7
39.9
33.2
12.0
10.1
33.2
32.5
4.9
4.3
Nestle*
Neutral
6,160
-
59,390
10,073
11,807
20.7
21.5
124.8
154.2
49.4
40.0
20.3
18.2
34.8
36.7
5.7
4.8
Tata Global
Neutral
119
-
7,479
8,675
9,088
9.8
9.8
7.4
8.2
16.0
14.5
1.8
1.7
7.9
8.1
0.8
0.7
Procter & Gamble
Accumulate
6,525
7,369
21,179
2,939
3,342
23.2
23.0
146.2
163.7
44.6
39.9
99.9
95.8
25.3
23.5
6.8
5.9
Hygiene
Stock Watch
November 28, 2016
Company Name
Reco
CMP
Target
Mkt Cap
Sales ( Čcr )
OPM(%)
EPS (Č)
PER(x)
P/BV(x)
RoE(%)
EV/Sales(x)
(Č)
Price ( Č)
( Č cr )
FY17E FY18E
FY17E
FY18E
FY17E
FY18E
FY17E
FY18E
FY17E
FY18E
FY17E
FY18E
FY17E
FY18E
IT
HCL Tech^
Buy
801
1,000
112,995
49,242
57,168
20.5
20.5
55.7
64.1
14.4
12.5
2.9
2.2
20.3
17.9
2.2
1.7
Infosys
Buy
977
1,249
224,480
68,350
77,326
27.0
27.0
62.5
69.4
15.6
14.1
3.3
3.0
21.3
21.6
2.7
2.4
TCS
Accumulate
2,301
2,620
453,366
119,025
133,308
27.6
27.6
131.2
145.5
17.5
15.8
5.7
5.2
32.4
33.1
3.6
3.2
Tech Mahindra
Buy
487
600
47,293
29,673
32,937
15.5
17.0
32.8
39.9
14.9
12.2
2.9
2.5
19.6
20.7
1.3
1.1
Wipro
Buy
465
590
113,005
55,440
60,430
18.1
18.1
35.9
39.9
13.0
11.7
2.3
2.1
19.0
19.3
1.8
1.6
Media
D B Corp
Neutral
363
-
6,664
2,297
2,590
27.4
28.2
21.0
23.4
17.3
15.5
4.0
3.5
23.7
23.1
2.7
2.3
HT Media
Neutral
71
-
1,658
2,693
2,991
12.6
12.9
7.9
9.0
9.0
7.9
0.8
0.7
7.8
8.3
0.2
0.1
Jagran Prakashan
Buy
170
225
5,548
2,355
2,635
28.0
28.0
10.8
12.5
15.7
13.6
3.4
3.0
21.7
21.7
2.4
2.1
Sun TV Network
Neutral
460
-
18,112
2,850
3,265
70.1
71.0
26.2
30.4
17.5
15.1
4.5
4.0
24.3
25.6
5.9
5.1
Hindustan Media
Neutral
269
-
1,976
1,016
1,138
24.3
25.2
27.3
30.1
9.9
9.0
1.9
1.7
16.2
15.8
1.3
1.1
Ventures
TV Today Network
Buy
312
385
1,862
637
743
27.5
27.5
18.4
21.4
17.0
14.6
3.0
2.5
17.4
17.2
2.5
2.1
Metals & Mining
Coal India
Neutral
304
-
192,081
84,638
94,297
21.4
22.3
24.5
27.1
12.4
11.2
5.2
4.9
42.6
46.0
1.8
1.6
Hind. Zinc
Neutral
273
-
115,330
14,252
18,465
55.9
48.3
15.8
21.5
17.3
12.7
2.8
2.5
17.0
20.7
8.1
6.3
Hindalco
Neutral
180
-
37,211
107,899
112,095
7.4
8.2
9.2
13.0
19.6
13.9
0.9
0.9
4.8
6.6
0.9
0.8
JSW Steel
Neutral
1,674
-
40,470
53,201
58,779
16.1
16.2
130.6
153.7
12.8
10.9
1.7
1.5
14.0
14.4
1.5
1.3
NMDC
Neutral
122
-
38,663
6,643
7,284
44.4
47.7
7.1
7.7
17.2
15.9
1.5
1.5
8.8
9.2
3.6
3.2
SAIL
Neutral
50
-
20,774
47,528
53,738
(0.7)
2.1
(1.9)
2.6
19.4
0.6
0.5
(1.6)
3.9
1.3
1.2
Vedanta
Neutral
223
-
66,187
71,744
81,944
19.2
21.7
13.4
20.1
16.7
11.1
1.4
1.3
8.4
11.3
1.3
1.0
Tata Steel
Neutral
408
-
39,596
121,374
121,856
7.2
8.4
18.6
34.3
21.9
11.9
1.4
1.3
6.1
10.1
1.0
0.9
Oil & Gas
Cairn India
Neutral
244
-
45,756
9,127
10,632
4.3
20.6
8.8
11.7
27.7
20.9
0.9
0.9
3.3
4.2
6.5
5.4
GAIL
Neutral
417
-
52,908
56,220
65,198
9.3
10.1
27.1
33.3
15.4
12.5
1.4
1.3
9.3
10.7
1.1
1.0
ONGC
Neutral
278
-
238,057
137,222
152,563
15.0
21.8
19.5
24.1
14.3
11.6
1.2
1.2
8.5
10.1
2.0
1.8
Indian Oil Corp
Neutral
297
-
143,978
373,359
428,656
5.9
5.5
54.0
59.3
5.5
5.0
0.9
0.8
16.0
15.6
0.5
0.5
Reliance Industries
Neutral
994
-
322,186
301,963
358,039
12.1
12.6
87.7
101.7
11.3
9.8
1.2
1.1
10.7
11.3
1.5
1.3
Pharmaceuticals
Alembic Pharma
Neutral
648
-
12,210
3,483
4,083
20.2
21.4
24.3
30.4
26.7
21.3
6.1
4.8
25.5
25.3
3.4
2.9
Aurobindo Pharma
Buy
740
877
43,297
15,720
18,078
23.7
23.7
41.4
47.3
17.9
15.6
4.6
3.6
29.6
26.1
3.0
2.6
Aventis*
Neutral
4,259
-
9,809
2,277
2,597
17.3
18.3
149.4
172.0
28.5
24.8
4.7
3.8
25.1
28.8
4.0
3.2
Cadila Healthcare
Neutral
405
-
41,472
10,429
12,318
22.6
22.0
16.9
19.2
24.0
21.1
6.1
4.9
28.5
25.7
4.0
3.3
Cipla
Reduce
563
490
45,269
15,378
18,089
17.4
18.4
21.6
27.2
26.1
20.7
3.4
2.9
13.7
15.2
3.1
2.6
Stock Watch
November 28, 2016
Company Name
Reco
CMP
Target
Mkt Cap
Sales ( Čcr )
OPM(%)
EPS (Č)
PER(x)
P/BV(x)
RoE(%)
EV/Sales(x)
(Č)
Price ( Č)
( Č cr )
FY17E FY18E
FY17E
FY18E
FY17E
FY18E
FY17E
FY18E
FY17E
FY18E
FY17E
FY18E
FY17E
FY18E
Pharmaceuticals
Dr Reddy's
Neutral
3,169
-
52,512
16,043
18,119
20.8
22.4
112.4
142.9
28.2
22.2
3.8
3.3
14.1
15.9
3.2
2.9
Dishman Pharma
Neutral
243
-
3,927
1,718
1,890
22.7
22.8
9.5
11.3
25.6
21.5
2.5
2.2
10.1
10.9
2.8
2.4
GSK Pharma*
Neutral
2,669
-
22,609
3,000
3,312
15.4
20.6
46.5
60.8
57.4
43.9
13.8
13.7
26.3
30.6
7.3
6.6
Indoco Remedies
Reduce
272
240
2,504
1,112
1,289
16.2
18.2
11.6
16.0
23.4
17.0
3.7
3.2
17.0
20.1
2.4
2.0
Ipca labs
Accumulate
567
613
7,156
3,303
3,799
15.3
15.3
17.3
19.7
32.8
28.8
2.9
2.6
9.1
9.4
2.3
2.0
Lupin
Buy
1,509
1,809
68,045
15,912
18,644
26.4
26.7
58.1
69.3
26.0
21.8
5.1
4.1
21.4
20.9
4.4
3.6
Sun Pharma
Buy
712
847
171,393
31,129
35,258
32.0
32.9
30.2
35.3
23.6
20.2
3.8
3.2
20.0
20.1
5.1
4.3
Power
Tata Power
Neutral
70
-
18,946
36,916
39,557
17.4
27.1
5.1
6.3
13.7
11.1
1.2
1.1
9.0
10.3
1.5
1.4
NTPC
Neutral
161
-
133,123
86,605
95,545
17.5
20.8
11.8
13.4
13.7
12.1
1.4
1.3
10.5
11.1
2.9
2.9
Power Grid
Neutral
188
-
98,537
25,763
29,762
74.3
73.1
14.8
17.3
12.7
10.9
2.0
1.8
16.9
17.5
8.1
7.7
Real Estate
Prestige Estate
Buy
156
210
5,865
4,707
5,105
25.2
26.0
10.3
13.0
15.2
12.0
1.2
1.1
10.3
10.2
2.4
2.1
MLIFE
Buy
365
522
1,498
1,152
1,300
22.7
24.6
29.9
35.8
12.2
10.2
0.9
0.9
7.6
8.6
2.0
1.7
Telecom
Bharti Airtel
Neutral
301
-
120,262
105,086
114,808
34.5
34.7
12.2
16.4
24.7
18.3
1.7
1.6
6.8
8.4
2.1
1.8
Idea Cellular
Neutral
74
-
26,520
40,133
43,731
37.2
37.1
6.4
6.5
11.5
11.3
1.0
0.9
8.2
7.6
1.7
1.4
zOthers
Abbott India
Neutral
4,696
-
9,978
3,153
3,583
14.1
14.4
152.2
182.7
30.9
25.7
151.5
129.4
25.6
26.1
2.9
2.5
Asian Granito
Buy
196
351
590
1,071
1,182
12.1
12.4
12.7
16.0
15.4
12.3
1.5
1.3
9.5
10.7
0.9
0.7
Bajaj Electricals
Buy
217
274
2,189
4,801
5,351
5.7
6.2
10.4
13.7
20.8
15.8
2.6
2.3
12.4
14.5
0.5
0.4
Banco Products (India)
Neutral
181
-
1,291
1,353
1,471
12.3
12.4
14.5
16.3
12.5
11.1
17.2
15.5
14.5
14.6
0.9
95.6
Coffee Day Enterprises
Neutral
202
-
4,151
2,964
3,260
20.5
21.2
4.7
8.0
-
25.2
2.3
2.1
5.5
8.5
1.8
1.6
Ltd
Competent Automobiles Neutral
161
-
99
1,137
1,256
3.1
2.7
28.0
23.6
5.8
6.8
31.0
28.0
14.3
11.5
0.1
0.1
Elecon Engineering
Neutral
48
-
525
1,482
1,660
13.7
14.5
3.9
5.8
12.4
8.3
2.9
2.7
7.8
10.9
0.7
0.6
Finolex Cables
Neutral
402
-
6,144
2,883
3,115
12.0
12.1
14.2
18.6
28.3
21.6
15.1
13.2
15.8
14.6
1.8
1.6
Garware Wall Ropes
Neutral
612
-
1,340
873
938
14.3
14.3
35.2
37.5
17.4
16.3
3.1
2.6
17.5
15.9
1.4
1.3
Goodyear India*
Neutral
713
-
1,643
1,598
1,704
10.4
10.2
49.4
52.6
14.4
13.6
66.6
58.4
18.2
17.0
0.7
99.1
Hitachi
Neutral
1,378
-
3,747
2,081
2,433
8.8
8.9
33.4
39.9
41.3
34.5
33.3
27.7
22.1
21.4
1.8
1.5
HSIL
Neutral
297
-
2,144
2,384
2,515
15.8
16.3
15.3
19.4
19.4
15.3
19.3
16.6
7.8
9.3
1.1
1.0
Interglobe Aviation
Neutral
870
-
31,356
21,122
26,005
14.5
27.6
110.7
132.1
7.9
6.6
47.0
33.6
168.5
201.1
1.5
1.1
Jyothy Laboratories
Neutral
344
-
6,254
1,440
2,052
11.5
13.0
8.5
10.0
40.5
34.4
9.8
9.1
18.6
19.3
4.6
3.2
Kirloskar Engines India
Neutral
327
-
4,729
2,554
2,800
9.9
10.0
10.5
12.1
31.1
27.0
13.0
12.3
10.7
11.7
1.5
1.3
Ltd
Stock Watch
November 28, 2016
Company Name
Reco
CMP
Target
Mkt Cap
Sales ( Čcr )
OPM(%)
EPS (Č)
PER(x)
P/BV(x)
RoE(%)
EV/Sales(x)
(Č)
Price ( Č)
( Č cr )
FY17E
FY18E
FY17E
FY18E
FY17E
FY18E
FY17E
FY18E
FY17E
FY18E
FY17E
FY18E
FY17E
FY18E
zOthers
Linc Pen & Plastics
Neutral
234
-
346
382
420
9.3
9.5
13.5
15.7
17.4
14.9
3.0
2.6
17.1
17.3
1.0
0.9
M M Forgings
Neutral
428
-
517
546
608
20.4
20.7
41.3
48.7
10.4
8.8
58.7
51.9
16.6
17.0
0.8
0.7
Manpasand Bever.
Neutral
640
-
3,659
836
1,087
19.6
19.4
16.9
23.8
37.9
26.9
4.5
4.0
12.0
14.8
4.1
3.1
Mirza International
Buy
79
107
946
987
1,106
18.0
18.0
6.5
7.6
12.0
10.3
1.9
1.7
15.9
15.7
1.2
1.0
MT Educare
Neutral
114
-
453
366
417
17.7
18.2
9.4
10.8
12.2
10.5
2.7
2.3
22.2
22.3
1.1
1.0
Narayana Hrudaya
Neutral
349
-
7,134
1,873
2,166
11.5
11.7
2.6
4.0
132.0
88.1
8.1
7.3
6.1
8.3
3.9
3.4
Navkar Corporation
Buy
179
265
2,552
408
612
42.9
42.3
6.8
11.5
26.4
15.6
1.8
1.6
6.9
10.5
7.2
4.8
Navneet Education
Neutral
107
-
2,543
1,062
1,147
24.0
24.0
6.1
6.6
17.5
16.1
3.6
3.2
20.6
19.8
2.5
2.3
Nilkamal
Neutral
1,353
-
2,019
1,995
2,165
10.7
10.4
69.8
80.6
19.4
16.8
77.3
67.2
16.6
16.5
1.0
0.9
Page Industries
Neutral
12,513
-
13,957
2,450
3,124
20.1
17.6
299.0
310.0
41.9
40.4
278.7
212.7
47.1
87.5
5.7
4.5
Parag Milk Foods
Neutral
268
-
2,252
1,919
2,231
9.3
9.6
9.5
12.9
28.4
20.7
4.4
3.6
15.5
17.5
1.3
1.1
Quick Heal
Neutral
236
-
1,651
408
495
27.3
27.0
7.7
8.8
30.5
26.8
2.8
2.8
9.3
10.6
3.2
2.6
Radico Khaitan
Buy
118
147
1,576
1,667
1,824
13.0
13.2
6.7
8.2
17.8
14.5
1.6
1.5
9.0
10.2
1.3
1.2
Relaxo Footwears
Neutral
413
-
4,961
2,085
2,469
9.2
8.2
7.6
8.0
54.7
52.0
21.2
18.1
17.9
18.8
2.5
2.1
S H Kelkar & Co.
Neutral
296
-
4,279
1,036
1,160
15.1
15.0
6.1
7.2
48.5
41.2
5.2
4.8
10.7
11.5
4.0
3.5
Siyaram Silk Mills
Accumulate
1,224
1,605
1,147
1,733
1,948
11.6
11.7
96.6
114.7
12.7
10.7
1.9
1.7
15.3
15.7
0.9
0.8
Styrolution ABS India*
Neutral
593
-
1,043
1,440
1,537
9.2
9.0
40.6
42.6
14.6
13.9
37.3
33.9
12.3
11.6
0.7
0.6
Surya Roshni
Neutral
199
-
870
3,342
3,625
7.8
7.5
17.3
19.8
11.5
10.1
21.8
17.5
10.5
10.8
0.5
0.5
Team Lease Serv.
Neutral
855
-
1,462
3,229
4,001
1.5
1.8
22.8
32.8
37.6
26.0
4.0
3.5
10.7
13.4
0.4
0.3
The Byke Hospitality
Neutral
175
-
702
287
384
20.5
20.5
7.6
10.7
23.0
16.4
4.8
3.9
20.7
23.5
2.5
1.8
Transport Corporation of
Neutral
170
-
1,305
2,671
2,911
8.5
8.8
13.9
15.7
12.3
10.9
1.7
1.5
13.7
13.8
0.6
0.6
India
TVS Srichakra
Neutral
3,396
-
2,600
2,304
2,614
13.7
13.8
231.1
266.6
14.7
12.7
381.6
300.4
33.9
29.3
1.1
1.0
UFO Moviez
Neutral
443
-
1,223
619
685
33.2
33.4
30.0
34.9
14.8
12.7
2.1
1.8
13.8
13.9
1.7
1.3
Visaka Industries
Neutral
198
-
314
1,051
1,138
10.3
10.4
21.0
23.1
9.4
8.6
25.4
23.8
9.0
9.2
0.6
0.5
VRL Logistics
Neutral
266
-
2,428
1,902
2,119
16.7
16.6
14.6
16.8
18.3
15.8
4.0
3.5
21.9
22.2
1.4
1.2
Wonderla Holidays
Neutral
329
-
1,859
287
355
38.0
40.0
11.3
14.2
29.1
23.2
4.2
3.7
21.4
23.9
6.2
5.0
Source: Company, Angel Research; Note: *December year end; #September year end; &October year end; Price as on November 25, 2016
Market Outlook
November 28, 2016
Research Team Tel: 022 - 39357800
DISCLAIMER
Angel Broking Private Limited (hereinafter referred to as “Angel”) is a registered Member of National Stock Exchange of India
Limited,Bombay Stock Exchange Limited and Metropolitan Stock Exchange Limited. It is also registered as a Depository Participant with
CDSL and Portfolio Manager with SEBI. It also has registration with AMFI as a Mutual Fund Distributor. Angel Broking Private Limited is a
registered entity with SEBI for Research Analyst in terms of SEBI (Research Analyst) Regulations, 2014 vide registration number
INH000000164. Angel or its associates has not been debarred/ suspended by SEBI or any other regulatory authority for accessing
/dealing in securities Market. Angel or its associates/analyst has not received any compensation / managed or
co-managed public offering of securities of the company covered by Analyst during the past twelve months.
This document is solely for the personal information of the recipient, and must not be singularly used as the basis of any investment
decision. Nothing in this document should be construed as investment or financial advice. Each recipient of this document should make
such investigations as they deem necessary to arrive at an independent evaluation of an investment in the securities of the companies
referred to in this document (including the merits and risks involved), and should consult their own advisors to determine the merits and
risks of such an investment.
Reports based on technical and derivative analysis center on studying charts of a stock's price movement, outstanding positions and
trading volume, as opposed to focusing on a company's fundamentals and, as such, may not match with a report on a company's
fundamentals. Investors are advised to refer the Fundamental and Technical Research Reports available on our website to evaluate the
contrary view, if any.
The information in this document has been printed on the basis of publicly available information, internal data and other reliable
sources believed to be true, but we do not represent that it is accurate or complete and it should not be relied on as such, as this
document is for general guidance only. Angel Broking Pvt. Limited or any of its affiliates/ group companies shall not be in any way
responsible for any loss or damage that may arise to any person from any inadvertent error in the information contained in this report.
Angel Broking Pvt. Limited has not independently verified all the information contained within this document. Accordingly, we cannot
testify, nor make any representation or warranty, express or implied, to the accuracy, contents or data contained within this document.
While Angel Broking Pvt. Limited endeavors to update on a reasonable basis the information discussed in this material, there may be
regulatory, compliance, or other reasons that prevent us from doing so.
This document is being supplied to you solely for your information, and its contents, information or data may not be reproduced,
redistributed or passed on, directly or indirectly.
Neither Angel Broking Pvt. Limited, nor its directors, employees or affiliates shall be liable for any loss or damage that may arise from
or in connection with the use of this information.